Beyond Vanity Metrics: The Real Story of Product Growth
After years of celebrating the wrong numbers, I discovered why even successful teams miss true product health...
Para la versión en español, dale click aquí.
TL;DR
This article will explore what retention means in digital products and how to measure it effectively. We will discuss active customer retention, net revenue retention, and monthly active consumers. We will define key elements and best practices to ensure our measurements reflect the true health of our product.
Index
What is retention?
When we talk about digital products, retention refers to the metric that indicates the recurrence in the use of the product or payment over a period of time. For example:
Monthly Active Customer Retention: Number of people who made at least one successful payment per month.
Monthly Net Revenue Retention: Percentage of recurring revenue retained from existing customers over a specific period, considering upgrades, downgrades, and cancellations.
Monthly Active Consumer Retention: Number of people who used our product at least once per month.
These definitions help us understand three key aspects of retention:
Action measured: Use of the product or payment for the product.
Frequency measured: Daily, weekly, or monthly, depending on the cadence of use or payment. We will explore this further in this article, as defining the frequency is fundamental for a good retention reading.
Definition of Active: The difference between someone who performed the action at the indicated frequency and someone who is registered in the product but does not perform the measured action.
In summary, measuring consumer retention tells us how many people continue to use our product. On the other hand, customer and revenue retention reveals how many people pay us recurrently, which is crucial for the business's sustainability.
Another way to look at it is by answering the following questions:
What are the key elements and definitions to consider before measuring retention?
To measure retention effectively, we must be clear about some fundamental elements and definitions, including the type of calculation, identifying what we consider an active user, and differentiating between new and retained actives.
Define the type of calculation
Define Actives
Differentiate between New Actives & Retained Actives
1. Define the type of calculation
Day-N: Measures the percentage of users who return to the app on a specific day after the account creation or registration.
Rolling: Measures the percentage of users who return to the app on a particular day or any subsequent day.
Retention measured using "Rolling Retention" will always be higher than that calculated with "Day-N." We will use "Day-N Retention" as a reference in this reading.
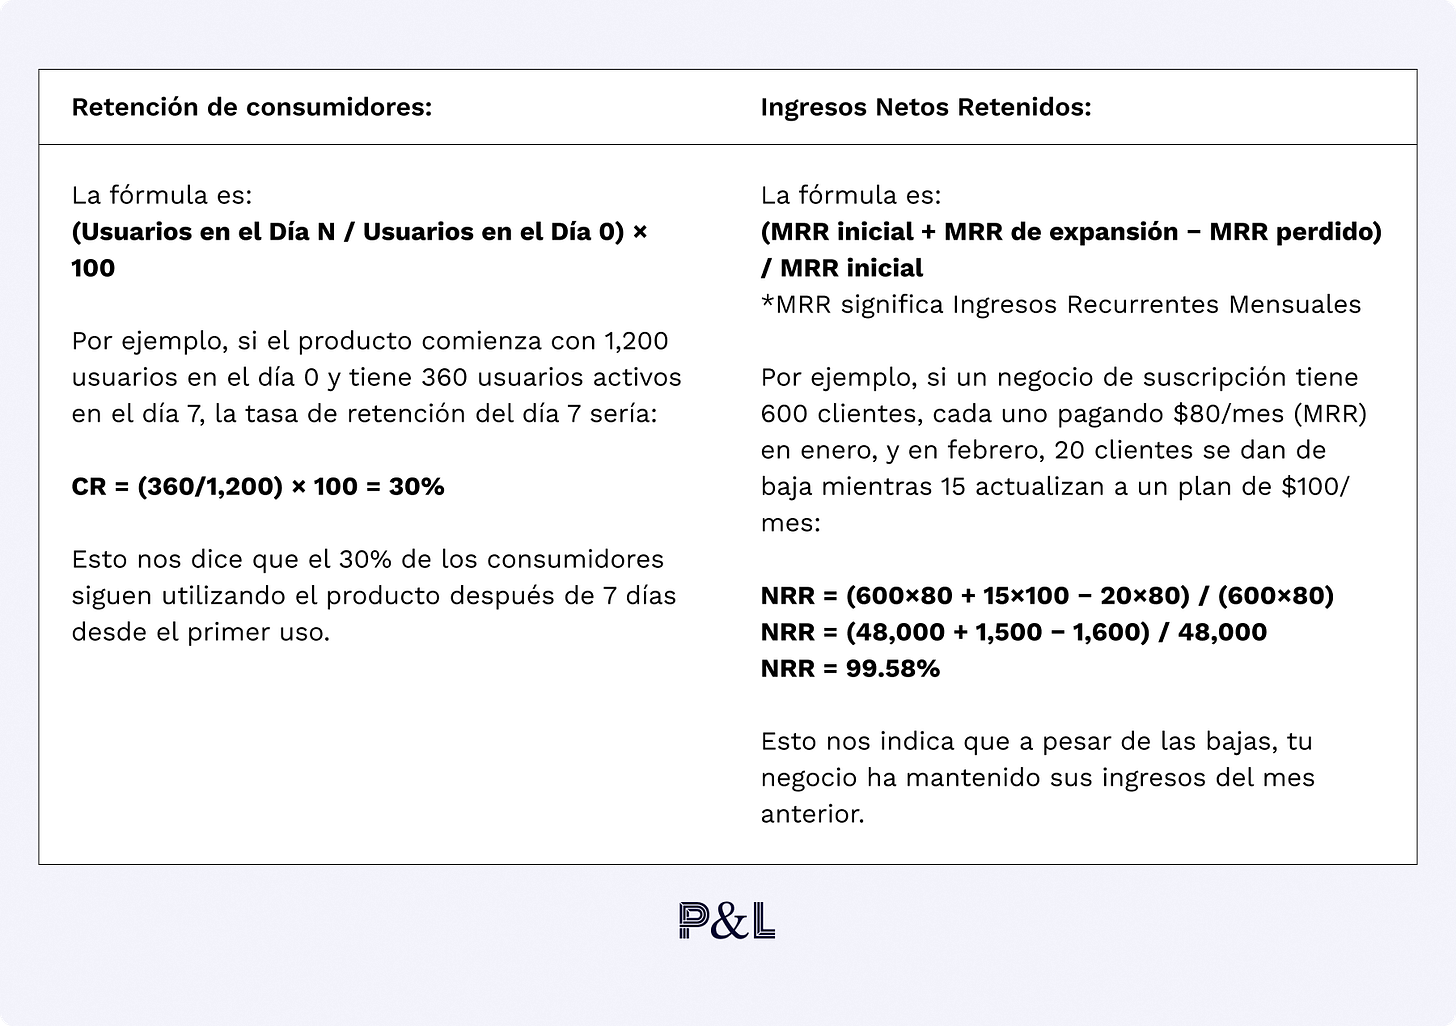
Examples of retention calculations using Day N Retention for CR & NRR
2. Define "Actives"
As an instrument, every product has a cycle of adoption and retention in both “use” and “payment”. This is because people learn to use or pay for our product, which we call adoption, and then make it part of their lives, generating a habit of use, which is retention. If we think of it this way, we can see the importance of internalizing the context and steps of how a person learns, uses, and benefits from our product.
That's why defining what we consider an active user is vital.
Active Consumer = Someone who performed the action considered as "use" of the product over a given period (Daily, Weekly, Monthly)
Active Customer = Someone who performed the action considered as "payment" for the product over a given period (Daily, Weekly, Monthly)
Let's imagine we are responsible for measuring retention in Netflix's video product.
Here, we could define:
Use = Watch a TV Series or Movies
Note: When we say "Watch a TV Series or Movies" it implies measuring when we consider someone has watched the Series or Movies, which can be a specific time range. Avoid marking these events as "sessions" or falling into the trap of measuring the buttons that start the video playback.
Payment: Making a successful payment for the subscription.
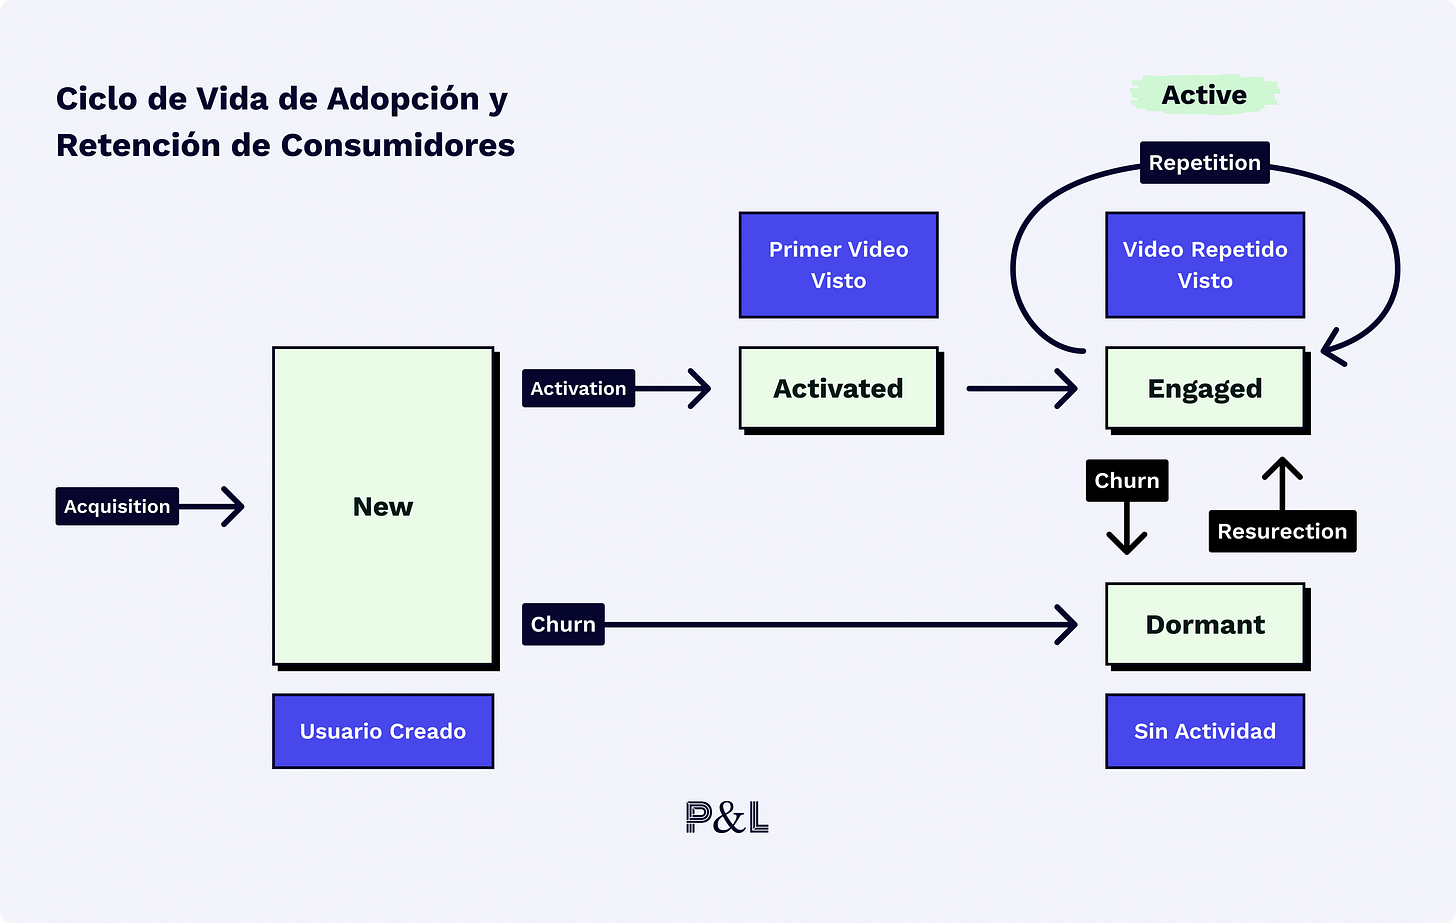
With this information, we could visually map the product's adoption cycle.
Let's look at the definitions of the different states for the consumer in the adoption and retention cycle:
Visitor: A person who visits or interacts with our promotional material but does not register.
Registered User: A registered person who has yet to use the product.
Activated User: A person who uses the product according to the assigned frequency for measuring retention.
Active User: A person who regularly uses the product according to the assigned frequency. This includes new, retained, and resurrected active users.
New Active User: A person who uses the product for the first time.
Retained Active User: A person who has used the product in at least two-time intervals.
Resurrected User: A person who stopped using the product and has returned to use it in the current time interval.
Dormant User: A person who has stopped using the product.
💡 Pro-tip from a product leader:
Consumer retention and customer retention are connected because for someone to pay for the product or continue paying for the product, they must first use it and enjoy the benefit for which it was designed. If this happens, there is a chance that the person will continue to use the product regularly and thus become a retained consumer and customer over time.
For example, Netflix:
If we only measured the number of people paying for the service per month without measuring the number of people watching TV Shows or Movies per month, we would be measuring customer retention.
In this case, when we have a decline in recurring customers, we could act reactively because we only see how many people are about to cancel their monthly payment by analyzing how many have stopped watching TV Series or Movies. This is just a use case to represent the importance of measuring both metrics and understanding how the "use" helps execute the "payment."
3. Differentiate between New Actives & Retained Actives
It is important to separate new actives from retained actives to avoid measurement errors. We often end up adding both, giving us the illusion that we are growing. However, in reality, we may only be acquiring more new users and often increasing our CAC.
New actives: People who use or pay for the first time.
Retained actives: People who use or pay regularly; this is marked by the frequency we decide to measure (daily, weekly, or monthly).
To illustrate this better, let's look at an example of consumer retention.
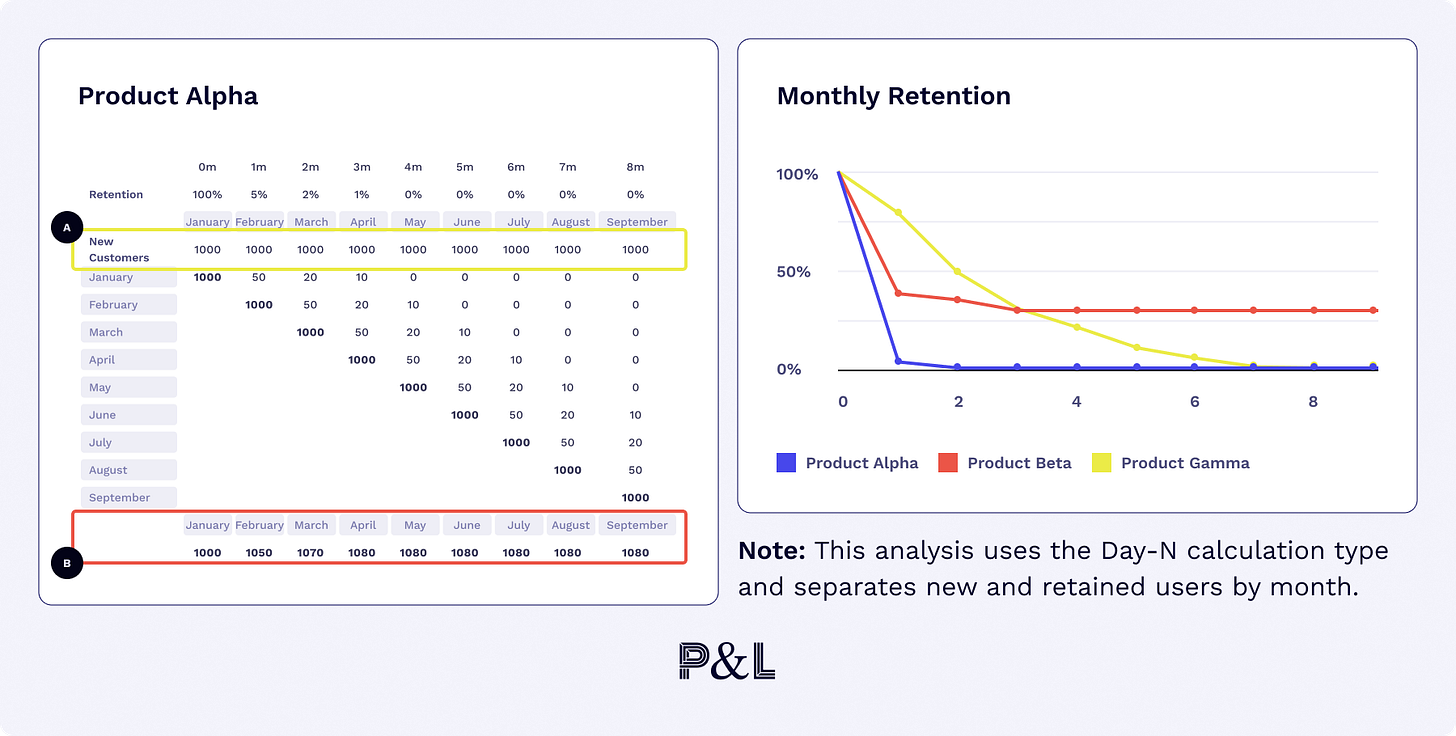
For example, in the analysis of Product Alpha, we can see in section A that each month we have 1k New Actives, but only 5% to 1% Retained Actives per month. This tells us that our product has a retention problem.
However, if we look at section B, where we add New Actives and Retained Actives, this gives us Total Actives per month, but it gives us the illusion that our numbers are growing per month when, in reality, we have more New Actives per month but fewer Retained.
Now, let's look at an example of Revenue Retention.
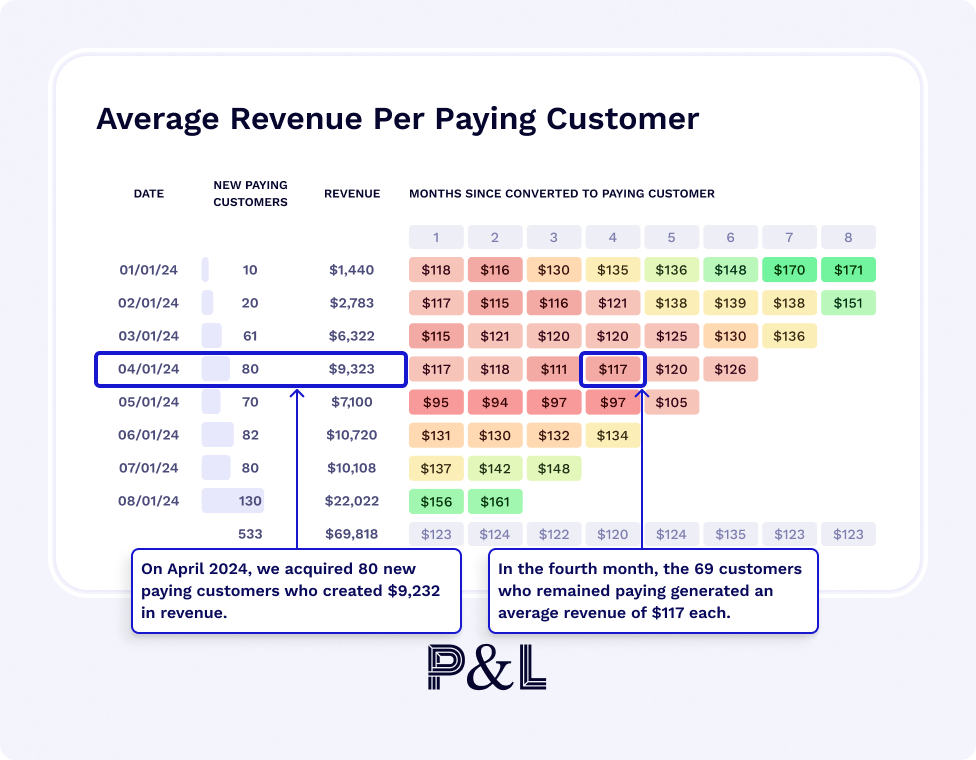
In the following example, we can see a revenue retention analysis where we separate user cohorts using the first month of payment as the starting point and the average revenue per user (ARPU) as the value for each month. This will help you see if you retain revenue and have revenue contractions or expansions over time.
Let's dive deep into the example:
In the cohort of April 1, we can see that 80 people made a payment in our product for the first time. Note that this does not mean they used the product or registered; remember, we are measuring payments here. Therefore, depending on your product's monetization model, this reflects that April 1 was their first successful payment. If your monetization model is freemium or based on trials, try to avoid measuring that time and measure when the person actually pays for the product.
Continuing with the example, in the fourth month, we can see the total MRR from this cohort is $3.8k, giving us a Retention Rate of 50%. This will help us understand how much revenue we have from the initial cohort of April 1.
If we keep monitoring this cohort and make a weighted average of the revenue, we can see how we are retaining our revenue, which will help us track Revenue Retention. For example, if in Month 4 we have $4.1k MRR, this will give us a Retention Rate of 53%.
Retention is a key metric that indicates how often users return to the product. It helps product managers understand if users find enough value to come back. The way to calculate retention is to divide the number of returning users in a given period by the number of users at the beginning of the period. Retention rates can be calculated for various intervals like daily, weekly, or monthly.
💡 Pro-tip from a product leader:
For example, a product with a high retention rate means that users are consistently finding value and choosing to continue using the product, whereas a low retention rate might indicate that users do not find the product useful or engaging enough to return.
Conclusion
To effectively measure customer retention, it is crucial to define what constitutes an active user and distinguish between new and retained users. Through examples, we have demonstrated how to analyze revenue retention and identify patterns of expansion or contraction. Measuring both consumer and revenue retention provides a comprehensive view of product health and, ultimately, sustainable growth.
In general, if our retained user curves show growth or stability, we are on the right track!
In the next blog, we will continue with this conversation and cover:
How to improve retention?
Where should we focus?
Más Allá de las Vanity Metrics : La Verdadera Historia del Product Growth
Después de años celebrando los números equivocados, descubrí por qué incluso los equipos exitosos no logran ver la verdadera salud del producto.
TL;DR
En este artículo, exploraremos qué es la retención en productos digitales y cómo medirla. Primero hablaremos de la definición de "clientes activos", "ingresos netos" y "consumidores activos mensuales". Con esto exploraremos los elementos clave y las mejores prácticas para asegurarnos de que nuestras mediciones reflejen el verdadero estado de salud de nuestro producto.
Indice
Que es retención?
Cuando hablamos de productos digitales, la retención se refiere a la métrica que nos indica la recurrencia en el uso del producto o el pago durante un periodo de tiempo. Por ejemplo:
Retención de clientes activos mensuales: Número de personas que realizaron al menos un pago exitoso por mes.
Retención de ingresos netos mensuales: Porcentaje de ingresos recurrentes retenidos de clientes existentes durante un período específico, considerando actualizaciones, degradaciones y cancelaciones.
Retención de consumidores activos mensuales: Número de personas que usaron nuestro producto al menos una vez por mes.
Estas definiciones nos ayudan a entender tres aspectos clave de la retención:
Acción medida: Uso del producto o el pago por el producto.
Frecuencia medida: Diaria, semanal o mensual, dependiendo de la cadencia de uso o pago, en este vamos a verlo mas afondo en este articulo dado definir la frecuencia es fundamental para una buena lectura de la retención.
Definición de Activo: Diferencia entre alguien que ejecutó la acción en la frecuencia indicada y alguien que está registrado en el producto pero no ejecuta la acción medida.
En resumen, medir la retención de consumidores nos indica cuántas personas siguen utilizando nuestro producto. Por otro lado, la retención de clientes e ingresos revela cuántas personas nos pagan recurrentemente, lo cual es crucial para la sostenibilidad del negocio.
Otra manera de verlo es a travez de contestar las siguientes preguntas:
¿Cuáles son los elementos y definiciones claves a tomar en cuenta antes de medir la retención?
Para medir la retención de manera efectiva, debemos tener claros algunos elementos y definiciones clave. Esto incluye definir el tipo de cálculo, identificar qué consideramos un usuario activo, y diferenciar entre activos nuevos y retenidos.
1- Definir el tipo de cálculo
2- Definir Activos
3- Diferenciar entre Activos Nuevos & Activos Retenidos
1- Definir el tipo de calculo
Day-N: Mide el porcentaje de usuarios que regresan a la aplicación en un día específico después de la creación de su cuenta o registro.
Rolling: Mide el porcentaje de usuarios que regresan a la aplicación en un día específico o cualquier día posterior.
La retención medida usando "Rolling Retention" siempre será más elevada que la calculada con "Day-N". En esta lectura, usaremos "Day-N Retention" como referencia
Ejemplos de cálculos de retención usando Day N Retention para CR & NRR
2. Definir "Activos"
Todo producto, como herramienta que es, tiene un ciclo de adopción y retención tanto en el uso como en el pago. Esto se debe a que las personas aprenden a usar o pagar por nuestro producto, a esto lo llamamos adopción, y luego lo convierten en parte de su vida, generando un hábito de uso, que es la retención. Si lo pensamos de esta manera, podemos ver que es importante internalizar el contexto y los pasos de cómo una persona aprende, usa y recibe beneficio de nuestro producto.
Es por eso que es crucial definir qué consideramos un usuario activo.
Consumidor Activo = Una persona que ejecuto la acción considerada como el "uso" del producto por un periodo de tiempo dado ( Diario, Semanal, Mensual )
Cliente Activo = Una persona que ejecuto la acción considerada como el "pago" del producto por un periodo de tiempo dado ( Diario, Semanal, Mensual )
Imaginemos que somos los responsables de medir retención en el producto de video de Netflix
Aquí podríamos definir:
1- Uso = Ver TV Series o Películas
Nota: Cuando decimos “Ver TV Series o Películas” implica medir cuando es que consideramos que alguien Ve la Series o Películas y esto puede ser un rango de tiempo determinado. Evita marcar estos eventos como sesiones o caer en la trampa de medir botones que empiecen la reproducción del video.
2- Pago: Realizar un pago exitoso por la suscripción.
Con esta información podríamos mapear visualmente el ciclo de ciclo de adopción del producto.
Veamos las definición de los diferentes estados para el consumidor en el ciclo de adopción y retención:
Visitante (Visitor): Persona que visita o interactúa con nuestro material promocional pero no se registra.
Consumidor registrado o cuenta creada (Registered User): Persona que se registra pero aún no utiliza el producto.
Consumidor activado (Activated User): Persona que utiliza el producto según la frecuencia asignada para medir la retención.
Consumidor activo (Active User): Persona que usa el producto regularmente según la frecuencia asignada. Incluye nuevos, retenidos y resucitados consumidores activos.
Consumidor nuevo activo (New Active User): Persona que usa el producto por primera vez.
Consumidor retenido activo (Retained Active User): Persona que ha usado el producto en al menos dos intervalos de tiempo.
Consumidor resucitado (Resurrected User): Persona que dejó de usar el producto y ha vuelto a utilizarlo en el presente intervalo de tiempo.
Consumidor inactivo (Dormant User): Persona que dejó de utilizar el producto.
💡 Pro-tip:
La retención de consumidores y la retención de clientes están conectadas, dado que para que alguien pague por el producto o siga pagando por producto, primero debe utilizarlo y disfrutar del beneficio por el cual fue diseñado, si esto pasa hay probabilidades de que la persona siga utilizando el producto de manera recurrente y por lo tanto se vuelva en un consumidor y cliente retenido sobre el tiempo.
Por ejemplo, Netflix:
Si solo medimos cuantas personas nos pagan por el servicio por mes, sin medir cuantas personas ven TV Series o Películas por mes, estaríamos midiendo retención de clientes. En este caso cuando tengamos un declive de clientes recurrentes estaríamos actuando de manera reactiva, dado que podríamos ver cuantas personas están a punto de cancelar su pago mensual, analizando cuantas de ellas han dejado de ver TV Series o Películas, lo anterior es solo un caso de uso para representar la importancia de medir ambas métricas y entender como "el uso" ayuda a ejecutar "el pago".
3- Diferenciar entre Activos Nuevos & Activos Retenidos
Es importante separar los nuevos activos de los retenidos para evitar errores en la medición, dado que muchas veces terminamos agregando ambos y esto nos da la ilusión de que estamos creciendo. Sin embargo, en realidad, puede ser que solo estemos adquiriendo más usuarios nuevos y muchas veces incrementando nuestro CAC.
Nuevos activos: Personas que usan o pagan por primera vez.
Activos retenidos: Personas que usan o pagan de manera recurrente, y esto está marcado por la frecuencia que decidimos medir (diaria, semanal o mensual).
Para ilustrar esto mejor, veamos un ejemplo de retención de consumidores.
Por ejemplo, en el análisis del Producto Alpha , podemos apreciar en el apartado A, que cada mes tenemos 1k Nuevos Activos cada mes, pero solo 5% al 1% de Retenidos Activos por mes, esto nos dice que nuestro producto tiene un problema de retención.
Sin embargo, si vemos el apartado B , los numeros lucen mejor porque estamos agregando los Nuevos Activos y Retenidos Activos por mes, y nos da la ilusión de que nuestros números están creciendo por mes, cuando en realidad, si tenemos mas Nuevos Activos por mes, pero menos Retenidos.
Ahora vemos un ejemplo de Retención de Ingresos
En el siguiente ejemplo, podemos ver un análisis de retención de ingresos donde separamos los cohorts de usuarios usando el primer mes de pago como punto de partida y el promedio de ingresos por consumidor (ARPU) como valor por cada mes. Esto no solo te ayudará a ver si estás reteniendo los ingresos, sino que también será visible si tienes contracciones o expansiones de ingresos a lo largo del tiempo.
Adentrémonos en el ejemplo:
En el cohort del primero de abril, podemos ver que tenemos 80 personas que hicieron un pago en nuestro producto por primera vez. Ojo, esto no significa que usaran el producto o que se acaban de registrar; recuerden, estamos midiendo pagos aquí. Por lo tanto, dependiendo de cuál sea el modelo de monetización de tu producto, lo que esto nos está reflejando es que el primero de abril fue su primer pago exitoso. Si tu modelo de monetización es freemium o basado en trials, trata de evitar medir ese tiempo y mide cuando la persona realmente paga por el producto
Siguiendo con el ejemplo, en el cuarto mes, que en este caso sería julio, 71 de los 76 originales siguen pagando. Mes con mes tenemos un ARPU de $115 USD. Ahora podemos ver que es casi el mismo valor monetario que en el primer mes, y esto es porque, aunque tenemos menos consumidores pagando, vemos que los consumidores que se quedan nos están pagando más dinero, y a esto le llamamos expansión de ingresos.
Si volvemos a observar el análisis de cohorts, vemos una expansión de ingresos en todos los cohorts desde julio y agosto. Esto puede ser por múltiples factores, quizá incrementamos los precios o nuestros clientes nos compran/pagan más y más frecuentemente.
Como concepto general, para evaluar la retención, basta con ver la curvatura de Activos Retenidos de nuestros cohorts a lo largo del tiempo. Si vemos que la curva de Activos Retenidos crece o se estabiliza, significa que vamos por buen camino.
⭐️ Pro-tip: Evitar la trampa de los porcentajes o las agregaciones
Para evitar errores en la medición de retención, siempre recomiendo visualizar la retención de consumidores, clientes e ingresos en un solo dashboard y utilizar totales y no porcentajes. Esto nos ayudará a tomar decisiones informadas y a mejorar la retención en ambas áreas clave.
Conclusión
Para medir la retención efectivamente, es fundamental definir qué es un activo y separar los nuevos de los retenidos. A través de ejemplos, hemos demostrado cómo analizar la retención de ingresos y detectar patrones de expansión o contracción.
Medir tanto la retención de consumidores como la de ingresos nos proporciona una mejor lectura de la salud del producto y evaluar si estamos creciendo de manera sustentable.
En general, si nuestras curvas de activos retenidos muestran crecimiento o estabilidad, vamos por buen camino!
En el siguiente Blog vamos a ver:
Cómo mejorar la retención?
Dónde Debemos enfocarnos?


